
The Socioeconomic Achievement Gap in the US Public Schools

Photo by Katerina Holmes

By Kate Bradley
Published Fall 2022
Special thanks to Grace Wilson for editing and research contributions.
Summary+
Impoverished children are severely disadvantaged before even reaching adulthood. In public schools, lower-income children are significantly less likely to succeed than their wealthier classmates. Poverty affects a child’s brain development, inhibiting their ability to learn and understand. In addition, lower-income students go to schools with insufficient funding and resources: quality teachers or the lack thereof increase the inability to provide for these students adequately. The achievement gap affects students by increasing dropout rates. It involves the nation by costing the US nearly $700 billion annually.1 Even more grave than the financial consequences is the loss of every student—each with untold potential. Fortunately, something is being done. Early childhood education has proven to equip students with the tools before entering a public school. Each attempt to help a student, no matter what stage of education they’re at, can help close the achievement gap.
Key Takeaways+
- The socioeconomic achievement gap in public schools is a social issue that has evolved over time and affects the whole country.
- Poverty affects all aspects of child development, emotional and physical, which limits an impoverished child’s ability to learn and perform well in school.140
- Insufficient funding, lack of resources, and poor teacher training in low-income schools also contribute to the gap between lower-income and higher-income students.
- The achievement gap reduces the potential of thousands of profitable workers and damages the US economy.
- Poor school performance in lower-income students perpetuates chronic poverty through higher dropout rates and impeded employment.
- Early childhood education provides structure during cognitive and social development, which can minimize the socioeconomic achievement gap.
Key Terms+
Achievement Gap—A gap occurs when one group of students performs better than another, and the difference is statistically significant. The groups may be classified by race or ethnicity, gender, or socioeconomic class.2 Occasionally, the achievement gap will be referred to as an opportunity gap to focus more on the lack of resources than student output.
ECE—Early childhood education.
High Poverty—A term used to describe a school with a significant population of impoverished students. A school is considered high poverty when 75% or more of the student population qualifies for free or reduced lunch.3
Longitudinal Study—A study that tracks the same participants over a long period of time. In the context of education, longitudinal studies are used to study the same individuals for different variables, using a variety of measurements such as test scores or qualitative data.4
SES—An acronym frequently used that stands for socioeconomic status.5 It can reference any socioeconomic class, such as low SES or high SES.
Title I—A rating system that indicates a school is eligible to receive Title I funding from the Elementary and Secondary Education Act. It typically means a school where 40% or more of the student population qualifies for free or reduced lunch. 70% of public schools receive some form of Title I funding.6
Context
Q: What is the socioeconomic and academic achievement gap?
A: An achievement gapA gap occurs when one group of students performs better than another, and the difference is statistically significant. The groups may be classified by race or ethnicity, gender, or socioeconomic class.2 Occasionally, the achievement gap will be referred to as an opportunity gap to focus more on the lack of resources than student output. occurs when any group of students performs at a statistically significantly lower rate than another group of students. This gap can appear at the individual student performance level as well as at the school test level.7 Achievement gaps can be measured by race, ethnicity, gender, or social class. When lower-income students perform lower than their higher-income classmates, there is a socioeconomic status (SESAn acronym frequently used that stands for socioeconomic status.5 It can reference any socioeconomic class, such as low SES or high SES.) academic achievement gap.8
Research has confirmed that lower-income students perform worse in school as measured by academic tests—roughly 1 standard deviation lower, or about 3 academic years behind.9 Low SESAn acronym frequently used that stands for socioeconomic status.5 It can reference any socioeconomic class, such as low SES or high SES. students enter high school with average literacy skills 5 years behind their high SES counterparts.10 low SES students are behind in reading and math proficiency by 20–26 percentage points compared to high SES students.11 The success rate of low SES students in STEM fields is significantly lower than high SES students.12 Lower SESAn acronym frequently used that stands for socioeconomic status.5 It can reference any socioeconomic class, such as low SES or high SES. students are also disciplined and suspended more frequently and attend class less.13 The socioeconomic achievement gapA gap occurs when one group of students performs better than another, and the difference is statistically significant. The groups may be classified by race or ethnicity, gender, or socioeconomic class.2 Occasionally, the achievement gap will be referred to as an opportunity gap to focus more on the lack of resources than student output. has been correlated with increased dropout rates (7.2% low SES students compared to 3.6% mid and 3.9% high SES students), lower likelihood of college graduation (14% compared to 60%), and a higher likelihood of incarceration.14, 15, 16
Q: How is socioeconomic status defined and measured? Who qualifies as having lower socioeconomic status?
A: As defined by the National Assessment of Educational Progress (NAEP), a congressionally mandated program overseen by the Department of Education, socioeconomic status is the combination of social and economic factors that indicate a child’s household income or opportunity.17 A variety of data is used to calculate SESAn acronym frequently used that stands for socioeconomic status.5 It can reference any socioeconomic class, such as low SES or high SES. as accurately as possible, including household size, family income, parental occupation, and parental level of education.18 For example, one common standard of measurement is that a child is considered impoverished if their guardians earn less than $25,926.00 per year.19 Globally, SES is measured through the child’s parents or guardians’ education and occupation as well as the number of books in the home.20
When poverty is measured within the context of American public education, such as when schools are considered for Title IA rating system that indicates a school is eligible to receive Title I funding from the Elementary and Secondary Education Act. It typically means a school where 40% or more of the student population qualifies for free or reduced lunch. 70% of public schools receive some form of Title I funding.6 funding, those eligible for free and reduced-price lunch (FRPL) is a proxy measurement of household income used by the government. This data is reliably available at the school level, unlike the poverty rate, income level, and occupation of parents.21 A student is eligible for free lunch if their family income is 130% at or below the poverty level and eligible for reduced lunch if their family income falls between 130–185% of the poverty level.22 For the 2021–2022 school year, the federal poverty guideline used to determine FRPL was an annual income of $26,500.00 for a family of 4.23 There has been recognition of the flaws of using FRPL as a proxy poverty measurement. In some cases, some students who live above the poverty rate may still be eligible for free or reduced lunch.24 These may be students within a foster program with disabilities or students who attend a school that is eligible to provide free lunch and breakfast for all students.25, 26 It should also be noted that federal lunch eligibility was extended to all schoolchildren during the outbreak of the COVID-19 pandemic. Still, FRPL is utilized today both at the national level of statistical analysis and in academic studies.27
The eligibility of FRPL is also used to measure the poverty level of public schools.28 A school is considered high povertyA term used to describe a school with a significant population of impoverished students. A school is considered high poverty when 75% or more of the student population qualifies for free or reduced lunch.3 when 75% or more of the student population qualifies for free or reduced lunch.29
Q: Who in the US is most likely to experience the SES achievement gap?
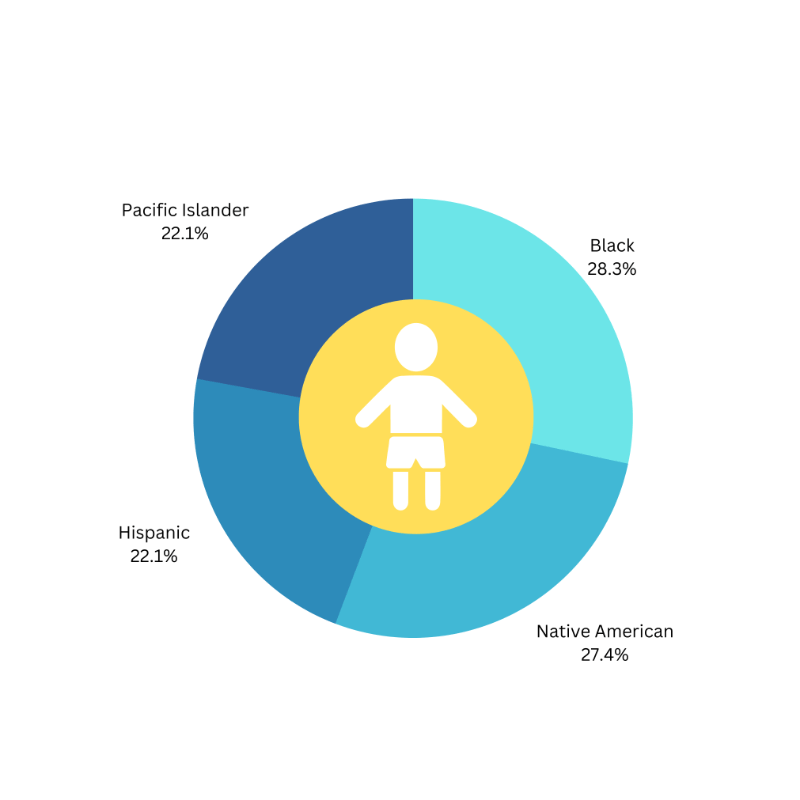
A: Geographically, 17 states have higher child-poverty rates than the national average poverty rate for children. Of those 17 states, 13 were located in the South.30 For children living in poverty, the highest poverty rate is in mother-only households, while the lowest is in married-couple households. It is highest within families where parents have not completed high school and lowest where either parent has completed a bachelor’s or higher degree. In 2018, 32% of Black children were living in poverty, 31% of Native American children, 25% of Hispanic children, and 25% of Pacific Islander children.31
It is important to note that many disadvantaged populations, such as racial and ethnic minorities, are significantly related to the wealth disparity in students. According to the 2020 Census Bureau, a disproportionate amount of children of color live in poverty.32 Many minority groups experience higher poverty rates than their white counterparts.33 This disparity means minority students are more vulnerable to low socioeconomic status. However, although socioeconomic status and race are congruent, they are not interchangeable; the focus of this brief is solely on the socioeconomic achievement gapA gap occurs when one group of students performs better than another, and the difference is statistically significant. The groups may be classified by race or ethnicity, gender, or socioeconomic class.2 Occasionally, the achievement gap will be referred to as an opportunity gap to focus more on the lack of resources than student output.. Researchers have largely focused on the racial achievement gap, resulting in a lack of scholarship regarding the socioeconomic achievement gap.34 In fact, the racial achievement gaps appear to be decreasing, while the SESAn acronym frequently used that stands for socioeconomic status.5 It can reference any socioeconomic class, such as low SES or high SES. achievement gap remains stagnant or increasing.35 This decrease is likely due to greater awareness of the racial achievement gapA gap occurs when one group of students performs better than another, and the difference is statistically significant. The groups may be classified by race or ethnicity, gender, or socioeconomic class.2 Occasionally, the achievement gap will be referred to as an opportunity gap to focus more on the lack of resources than student output. among Americans and the creation of more legislation to address it in recent years.36
Q: How has the achievement gap evolved over the years?
A: Though the SESAn acronym frequently used that stands for socioeconomic status.5 It can reference any socioeconomic class, such as low SES or high SES. achievement gapA gap occurs when one group of students performs better than another, and the difference is statistically significant. The groups may be classified by race or ethnicity, gender, or socioeconomic class.2 Occasionally, the achievement gap will be referred to as an opportunity gap to focus more on the lack of resources than student output. has existed since the Industrial Revolution, it has been documented since the late 1930s. Due to racism and biases, no action was taken to address the SES achievement gap for many years because of the high correlation between race and low SES. As late as 1995, some scholars falsely attributed low school performance to biological inadequacy among different races and ethnicities.37 However, the SES achievement gap was still monitored throughout the years. Among a 1950s cohort of schoolchildren, low SES children were 4 years behind their high SES peers.38
Current research disagrees with whether the SESAn acronym frequently used that stands for socioeconomic status.5 It can reference any socioeconomic class, such as low SES or high SES. achievement gapA gap occurs when one group of students performs better than another, and the difference is statistically significant. The groups may be classified by race or ethnicity, gender, or socioeconomic class.2 Occasionally, the achievement gap will be referred to as an opportunity gap to focus more on the lack of resources than student output. is stagnant or increasing, but all researchers agree it is not decreasing. Evidence of the stagnancy of the gap, research showed little variation in how students within each socioeconomic class performed between 1954–2001.39 A working paper published by the American Research Institutes reported that 34 of the 50 states showed no statistically significant change in the SES achievement gap from 2003 to 2017.40

Other data reveals that in 14 states, the gap is significantly widening.41 Only 2 states, New Mexico and Tennessee, showed significant decreases in the SESAn acronym frequently used that stands for socioeconomic status.5 It can reference any socioeconomic class, such as low SES or high SES. achievement gapA gap occurs when one group of students performs better than another, and the difference is statistically significant. The groups may be classified by race or ethnicity, gender, or socioeconomic class.2 Occasionally, the achievement gap will be referred to as an opportunity gap to focus more on the lack of resources than student output..42 Most reports indicate that the SES achievement gap has not increased but rather has remained the same since the 1950s.43
Q: What legislation exists to address the SES achievement gap in the US?
A: The first federal policy intended to aid low SESAn acronym frequently used that stands for socioeconomic status.5 It can reference any socioeconomic class, such as low SES or high SES. students was Title IA rating system that indicates a school is eligible to receive Title I funding from the Elementary and Secondary Education Act. It typically means a school where 40% or more of the student population qualifies for free or reduced lunch. 70% of public schools receive some form of Title I funding.6 of the Elementary and Secondary Education Act (ESEA) as part of President Lyndon Johnson’s “war on poverty” in 1965. The act offered grants to lower-income school districts.44 This is why schools that receive federal funding today are called Title 1 schools. Measurements and studies of the achievement gapA gap occurs when one group of students performs better than another, and the difference is statistically significant. The groups may be classified by race or ethnicity, gender, or socioeconomic class.2 Occasionally, the achievement gap will be referred to as an opportunity gap to focus more on the lack of resources than student output. as it is known today began in the early 80s and 90s.45 Twenty years later, the No Child Left Behind Act was instigated as an attempt to reduce the achievement gap and help low SES students improve their academic proficiency. The NCLB Act focused heavily on standardized testing, Title I spending, and school choice. If schools consistently failed state and national standards for at least 3 consecutive years, then the schools had to use Title I funding to help lower-income students find resources or other options in the public or private sector.46 The NCLB act focuses on literacy rates, assessment of Title IA rating system that indicates a school is eligible to receive Title I funding from the Elementary and Secondary Education Act. It typically means a school where 40% or more of the student population qualifies for free or reduced lunch. 70% of public schools receive some form of Title I funding.6, and dropout prevention among disadvantaged students.47 At the end of 2015, the Department of Education passed the Every Student Succeeds Act, which focused on the equity of opportunity and allocating resources more equally across schools in order to decrease the achievement gap. Despite these policies and acts, there has been no significant nationwide decrease in the SES achievement gap.
Q: Where is the socioeconomic achievement gap prominent?
A: International Trends
The socioeconomic achievement gapA gap occurs when one group of students performs better than another, and the difference is statistically significant. The groups may be classified by race or ethnicity, gender, or socioeconomic class.2 Occasionally, the achievement gap will be referred to as an opportunity gap to focus more on the lack of resources than student output. exists in all countries to varying degrees; low SESAn acronym frequently used that stands for socioeconomic status.5 It can reference any socioeconomic class, such as low SES or high SES. students perform worse than their high SES peers in each country. Additionally, a study comparing the international exams from 1964–2015 found that the SES achievement gap is increasing globally.48 For instance, low SES high school students in Canada performed 8% worse than their high SES peers in mathematics and 9% worse in English.49 However, for the purpose of this brief, we will focus on trends within the US.50
A: Regional Trends
The research does not seem to indicate any significant trends by region in the US, although more children live in poverty in the South.51 The socioeconomic achievement gapA gap occurs when one group of students performs better than another, and the difference is statistically significant. The groups may be classified by race or ethnicity, gender, or socioeconomic class.2 Occasionally, the achievement gap will be referred to as an opportunity gap to focus more on the lack of resources than student output. is also larger in areas near or within Native American reservations due to the greater prevalence of poverty among indigenous reservations.52 Overall, low SESAn acronym frequently used that stands for socioeconomic status.5 It can reference any socioeconomic class, such as low SES or high SES. is an issue everywhere in the US.
A: State Trends
As mentioned previously, 34 of the 50 United States have shown no significant change in the SESAn acronym frequently used that stands for socioeconomic status.5 It can reference any socioeconomic class, such as low SES or high SES. achievement gapA gap occurs when one group of students performs better than another, and the difference is statistically significant. The groups may be classified by race or ethnicity, gender, or socioeconomic class.2 Occasionally, the achievement gap will be referred to as an opportunity gap to focus more on the lack of resources than student output., 14 have indicated significant widening, and 2 states have significant decreases.53
The public school system varies by state, mainly due to factors in determining the extent of the socioeconomic achievement gapA gap occurs when one group of students performs better than another, and the difference is statistically significant. The groups may be classified by race or ethnicity, gender, or socioeconomic class.2 Occasionally, the achievement gap will be referred to as an opportunity gap to focus more on the lack of resources than student output., like the state’s ability to distribute funds and mandate what is taught, how districts are organized. About 92% of public school funding comes through state and local funding, with a wide range between states.54 For example, the per pupil expenditure (PPE) in Massachusetts was 145% more than the national average in the 2017–2018 school year. In comparison, Mississippi and other states spend significantly less than the national average on pupils.55 State funding for public schools varies widely between states, mirroring the varied academic achievement of state schools. The following paragraphs focus on 4 states that exemplify a variety of SESAn acronym frequently used that stands for socioeconomic status.5 It can reference any socioeconomic class, such as low SES or high SES. achievement gap trends. The analysis includes 2019 NAEP mathematics test scores for both high and low-income 8th graders. For comparison, the national average score was 282.
Massachusetts has some of the highest PPE but also high socioeconomic status and the highest test scores (1.18 grade levels above the average).56 While the achievement gapA gap occurs when one group of students performs better than another, and the difference is statistically significant. The groups may be classified by race or ethnicity, gender, or socioeconomic class.2 Occasionally, the achievement gap will be referred to as an opportunity gap to focus more on the lack of resources than student output. has remained the same, both high and low SESAn acronym frequently used that stands for socioeconomic status.5 It can reference any socioeconomic class, such as low SES or high SES. students’ test scores have improved over the past two decades. In Massachusetts, the average test score for the 2019 NAEP mathematics test for low SES was 272, and 303 for those with high SES—just below and above the national average.57
Mississippi is a state with low economic status and low PPE.58 In 2019, 74% of all public students were eligible for FRPL.59 Low SESAn acronym frequently used that stands for socioeconomic status.5 It can reference any socioeconomic class, such as low SES or high SES. students scored 267 on the NAEP math exam, while high SES students scored above average (295).60
According to a study comparing socioeconomic achievement gaps from 2003–2017, New Mexico was 1 of 2 states with a decrease in the SESAn acronym frequently used that stands for socioeconomic status.5 It can reference any socioeconomic class, such as low SES or high SES. achievement gapA gap occurs when one group of students performs better than another, and the difference is statistically significant. The groups may be classified by race or ethnicity, gender, or socioeconomic class.2 Occasionally, the achievement gap will be referred to as an opportunity gap to focus more on the lack of resources than student output. by 11 test score points.61 However, test scores for New Mexico are still 1.01 grades below the average.62 The state faced failing schools and teacher shortages during the NCLB era.63 Nevertheless, New Mexico has installed an early literacy program and raised standards for test scores.64 The 2019 NAEP tests scored 262 for low SESAn acronym frequently used that stands for socioeconomic status.5 It can reference any socioeconomic class, such as low SES or high SES. students and 289 for their high SES peers.65
California has the largest public school system in the United States. Lower-income Californian students scored 262 on the 2019 NAEP exam, while high SESAn acronym frequently used that stands for socioeconomic status.5 It can reference any socioeconomic class, such as low SES or high SES. students scored 298.66 Student test scores were 0.69 grade levels below average.67

Contributing Factors
Effects of Poverty on Physical and Emotional Development
Living in poverty affects all aspects of child development, including stunting normal brain development due to chronic poverty stressors, which limits an impoverished child’s ability to learn and perform well in school.74 As the brain continues to react to high-stress indicators related to poverty, such as chronic noise in households and conflict among family members for a sustained period of time, the creativity portion decreases, switching into a “survival mode” mindset.75, 76 The National Scientific Council of the Development of the Child calls this “toxic stress.”77 Toxic stress can cause permanent damage once children have reached adulthood, including lasting physiological effects on the brain and other organ systems like the immune system. Diminished or harmed brain development can lead to cognitive impairment. One study found that by age 5, just as children enter school, impoverished children already experienced a significant difference in cognitive skills than wealthier children, which only accumulated as the child ages.78 A longitudinal studyA study that tracks the same participants over a long period of time. In the context of education, longitudinal studies are used to study the same individuals for different variables, using a variety of measurements such as test scores or qualitative data.4 from the National Institutes of Health (NIH) found that lower-income infants and toddlers had a significantly smaller amount of gray matter than their higher-income peers over time.79 Gray matter is where all the thinking processes, as well as motor control, happen within the brain.80 Having a smaller amount of gray matter is correlated with lower cognitive, memory, and motor function.81 This finding is also concurrent with another study, which showed that impoverished children ages 4–18 had the least gray matter, the greatest delay in brain development, and the poorest academic achievement compared to other children.82
Apart from cognitive development issues, poverty can negatively affect students emotionally, which leads to behavioral issues that can negatively affect their academics. Due to the brain being stressed for such long periods of time, the child is more likely to overreact in low-stress situations.83 Additionally, a child’s ability to regulate emotion and attention is affected, as well as their ability to develop the mental process necessary for remembering instructions, juggling tasks, and paying attention.84, 85 Students may act out or lack proper social skills in a school environment,86 which can affect academic performance. These negative effects on the cognitive brain of the child lead to a lowered ability to control behavior and plan ahead.87 These behaviors can widen the achievement gapA gap occurs when one group of students performs better than another, and the difference is statistically significant. The groups may be classified by race or ethnicity, gender, or socioeconomic class.2 Occasionally, the achievement gap will be referred to as an opportunity gap to focus more on the lack of resources than student output. because they cause a spiral that leads to more punishment and less time in class. For example, 35% of male students in low SESAn acronym frequently used that stands for socioeconomic status.5 It can reference any socioeconomic class, such as low SES or high SES. schools were disciplined as compared to only 24% of their higher SES peers in a 2006 study.88 Additionally, a 2014 study done by Indiana University’s Equity Project showed that low SES students receive higher rates of out-of-school suspension.89
Insufficient Funding and Lack of Resources
Insufficient funding and lack of resources also play an important role in the achievement gapA gap occurs when one group of students performs better than another, and the difference is statistically significant. The groups may be classified by race or ethnicity, gender, or socioeconomic class.2 Occasionally, the achievement gap will be referred to as an opportunity gap to focus more on the lack of resources than student output.. Low SESAn acronym frequently used that stands for socioeconomic status.5 It can reference any socioeconomic class, such as low SES or high SES. students do not have the same resources as their wealthier peers, so their likelihood of academic success is limited. Since school funding comes from the property taxes of the area, schools surrounded by lower-income families (who own smaller, less-taxed properties) receive less funding from the local community.90 In 2018, the US spent about $1,000.00 less per pupil in a low SES school district than in a high SES district.91 One report found that 263 districts nationwide did not consider the number of impoverished children as an important factor when distributing funding.92 When school funding is allocated more equally across the school districts, high and lower-income, the test score gap is smaller between lower-income students and their wealthier peers.93

Photo by Oleksandr Pidvalnyi

Beyond funding, a lack of resources impacts students’ opportunities for academic success. High-poverty schools struggle to overcome obstacles that low-poverty schools don’t have. For example, there is a high teacher turnover rate in high-poverty schools. Plus, less-experienced, cheap-to-hire teachers tend to work at high-poverty schools, which contributes to the socioeconomic achievement gapA gap occurs when one group of students performs better than another, and the difference is statistically significant. The groups may be classified by race or ethnicity, gender, or socioeconomic class.2 Occasionally, the achievement gap will be referred to as an opportunity gap to focus more on the lack of resources than student output. because teachers with multiple years of experience are more successful at helping students perform well.94 In high school, fewer AP courses are offered in lower-income high schools. Students from low SESAn acronym frequently used that stands for socioeconomic status.5 It can reference any socioeconomic class, such as low SES or high SES. backgrounds are less likely to have access to informational materials about college.95 Low SES schools have significantly fewer library resources than high SES schools, including fewer full-time librarians and fewer books added per year.96, 97, 98 Ultimately, the lack of community funding and fewer resources limits the likelihood of success among low SES students.
Inadequate Teacher Training and Retention
Public school teachers receive no specific training for lower SESAn acronym frequently used that stands for socioeconomic status.5 It can reference any socioeconomic class, such as low SES or high SES. students to meet students' needs, which perpetuates the achievement gapA gap occurs when one group of students performs better than another, and the difference is statistically significant. The groups may be classified by race or ethnicity, gender, or socioeconomic class.2 Occasionally, the achievement gap will be referred to as an opportunity gap to focus more on the lack of resources than student output.. Unique needs for low SES students include specialized tutoring, more staff in the classroom,99 and parent intervention.100 Highly qualified teachers are defined by their degree and certification, but no requirement for poverty training.101 Poverty training mainly entails educating teachers about their poverty biases and unpacking poverty myths. Although there are a variety of nonprofit organizations that offer accreditation in poverty training,102 there is little motivation for teachers to get trained since there is no requirement.103 A teacher may be considered highly qualified to teach children but lack any preparation for the unique needs of low socioeconomic students.
Cross-cultural communication creates dissonance between lower-income students and their teachers, whose perspective typically comes from a middle-class demographic.104 In the 2017–2018 school year, 58% of public school teachers held a post-baccalaureate degree and an average base salary of $57,900.00.105 Most low SESAn acronym frequently used that stands for socioeconomic status.5 It can reference any socioeconomic class, such as low SES or high SES. students come from families with little formal education that may struggle to relate to their teachers’ expectations. A 2019 interview of teachers in Pennsylvania found that teachers recognized the indirect sources of poor academic achievement in low SES students (such as lack of food or poor hygiene) but consistently disregarded the more important reasons for poor achievement (such as parent involvement and home life).106
Many teachers feel poorly prepared to teach in low-income schools and lack the time and resources to provide the attention that lower-income students need.107 Few teachers change their curriculum to best suit the needs of their lower-income students, even in Title IA rating system that indicates a school is eligible to receive Title I funding from the Elementary and Secondary Education Act. It typically means a school where 40% or more of the student population qualifies for free or reduced lunch. 70% of public schools receive some form of Title I funding.6 schools where the majority of students are considered impoverished.108
In addition, high-poverty schools lack the resources to facilitate teaching students with learning challenges, which can negatively affect academic success. One study found that teachers determined low SESAn acronym frequently used that stands for socioeconomic status.5 It can reference any socioeconomic class, such as low SES or high SES. students to have more subjective learning disabilities (such as an emotional disability) at around twice the rate as their wealthier classmates.109 Similarly, children from low SES backgrounds are twice as likely to exhibit behavioral issues in schools, like inattention, disinterest, and a lack of cooperation, than their peers from higher SES backgrounds.110 Many teachers do not have the preparation to be able to recognize misbehavior as a learning disability or trauma. Impoverished students are less likely to be diagnosed with learning challenges like ADHD, which makes it difficult for teachers to accommodate.111 Many teachers choose to send low SES students into special needs education programs instead of addressing the student’s learning issues stemming from their socioeconomic status. These unique accommodations take up a teacher’s time and emotional resources, often leading to frustration and increased amounts of teachers leaving to find work elsewhere.
These differences in culture often lead teachers to leave the school or the profession entirely,112 which can lead to poor academic results in low SESAn acronym frequently used that stands for socioeconomic status.5 It can reference any socioeconomic class, such as low SES or high SES. students. When teachers leave high-poverty schools, the disruption has a negative effect on students, who must then adapt to new teachers’ teaching styles and methods. Schools with high teacher turnover rates perform worse than schools with low turnover rates; one study found that when teacher turnover rates were high, students’ mathematics scores declined from 8.2% to 10.2%.113 Turnover rate is a serious issue among high-poverty schools: 39% of high-poverty schools experience the highest rates of teacher turnover as opposed to only 13% of low-poverty schools.114 Therefore, teachers who are hired at these high-poverty schools are less likely to have the experience and accreditation of a wealthier, better-funded school. This teacher quality gap and high turnover rate result in disrupted student learning ability and perpetuates the SES achievement gapA gap occurs when one group of students performs better than another, and the difference is statistically significant. The groups may be classified by race or ethnicity, gender, or socioeconomic class.2 Occasionally, the achievement gap will be referred to as an opportunity gap to focus more on the lack of resources than student output..
Consequences
Loss of Potential US Economic Growth
The achievement gapA gap occurs when one group of students performs better than another, and the difference is statistically significant. The groups may be classified by race or ethnicity, gender, or socioeconomic class.2 Occasionally, the achievement gap will be referred to as an opportunity gap to focus more on the lack of resources than student output. negatively affects the long-term health of the United State’s economy and potential growth. In the short term, the achievement gap costs the US money because high-poverty schools require more funding in an effort to decrease the achievement gap with their more wealthy counterparts.115 In 2019, the government, through the Elementary and Secondary Education Act, granted over $15 billion to low SESAn acronym frequently used that stands for socioeconomic status.5 It can reference any socioeconomic class, such as low SES or high SES. students who are most at risk of failing or are failing academically.116 The achievement gap has cost the US economy more than all the combined recessions since the 1970s.117 If the US had eliminated the socioeconomic achievement gap by 1998, the US GDP in 2008 would have increased by $700 billion because of increased potential economic growth.118

Additionally, the achievement gapA gap occurs when one group of students performs better than another, and the difference is statistically significant. The groups may be classified by race or ethnicity, gender, or socioeconomic class.2 Occasionally, the achievement gap will be referred to as an opportunity gap to focus more on the lack of resources than student output. limits the potential for long-term economic growth in the United States. Each student has the potential to work and provide value to the US economy and therefore raise the value of the GDP. In countries where students perform well in subjects such as math and science, economic growth and productivity are greater than in those countries that do not provide such opportunities to learn.119 Even so, the achievement gap stifles the potential of thousands of profitable workers, and human capital is the base of the US economic system.120 The potential of all the students in the public education system is staggering, but the achievement gap decreases the fulfillment of that potential, which is a costly disadvantage.
Perpetuation of Poverty
One of the most debilitating effects of the socioeconomic achievement gapA gap occurs when one group of students performs better than another, and the difference is statistically significant. The groups may be classified by race or ethnicity, gender, or socioeconomic class.2 Occasionally, the achievement gap will be referred to as an opportunity gap to focus more on the lack of resources than student output. is the continuance of chronic poverty, mainly through the high school dropout rate. In 2012, a longitudinal studyA study that tracks the same participants over a long period of time. In the context of education, longitudinal studies are used to study the same individuals for different variables, using a variety of measurements such as test scores or qualitative data.4 found that 16% of low SESAn acronym frequently used that stands for socioeconomic status.5 It can reference any socioeconomic class, such as low SES or high SES. third graders who are not reading proficiently will not graduate high school on time.121 Even those of lower income who are proficient readers in third grade, 11% still don’t finish high school.122 Impoverished students already have to deal with higher insecurity that leads to a higher dropout rate, including homelessness, job security, and family instability.123 The socioeconomic class of a student directly correlates with the dropout rate. A low-income student is 5 times more likely to drop out of high school.124 In 2014, 11.6% of low-income families had a high school dropout compared to 2.8% of high-income families.125 According to the American Psychological Association, this dropout can also be reflected in higher education; students who come from families that earn the top 25% of income are 8 times more likely to receive a degree than students from the bottom 25%.126 The achievement gap persists in creating a high dropout rate for lower-income families.
Dropping out perpetuates poverty in lower-income families by impeding employment, limiting salaries, and increasing the poverty rate of children in the home. As more employers require higher credentials for employment and lower-skilled job opportunities are shrinking, high school dropouts are struggling to find and remain employed.127 The rate of unemployment for high school dropouts is over 50%.128 Often these jobs are unstable, with fewer benefits. Even if a high school dropout is employed, a high school dropout aged 25–34 will earn about $26,000.00, while their peers who have completed high school will earn about $32,000.00.129 The dropout rate maintains poverty in the next generation as well. The poverty rate for a child where neither parent has received a high school diploma is 43%. In comparison, in a family where either parent has a college degree, the poverty rate is 4%.130
Practices
Early Education
Poverty can disadvantage students at an early age, setting them up for failure well before they enter the public education system. Impoverished children are less likely to be read to and spoken to less before entering public school.131 Early childhood education provides structure during a foundational stage: the development of a child’s cognitive, social, and emotional skills.132 In this period, children are highly influenced by the people and environment around them.133 Some early education options include government-funded organizations such as Head Start or private preschools.
Early education can help provide equal footing for children growing up in lower-income households. Early education teaches students vocabulary, social skills, and basic reading and math exposure. It also provides working parents with a safe place for children to attend during work hours. However, only 19% of low-income families enroll in high-quality early childhood education, while 29% of high-income families do.134

Impact
Research has shown that early education can have a meaningful impact on impoverished children, both in the short term and the long term. In the short term, early childhood education helps prepare students by developing their social, emotional, and cognitive growth.135 One study found that while students enrolled in ECEEarly childhood education. tended not to receive better SAT or test scores, early education did affect their social and mental well-being.136 This study accounted for the variety of long-term success in students that matriculate in some form of preschool.
In the long term, students who have received early education tend to minimize threats that could potentially prolong their impoverished situation. Children of the Perry Preschool Project, a research study conducted in the 1960s to see if positive experiences in preschool had an impact on later school performance, were significantly more likely to have graduated from high school (66% versus 45%) and half as likely to have an unwanted teen pregnancy. By age 40, the participants were 46% less likely to be incarcerated or 33% less likely to have committed a violent crime. A researcher studied the children of these participants and also found the children to be less at-risk.137 More recently, a 2017 study reiterated that children who receive ECEEarly childhood education. are 22% less likely to be held behind and 74% more likely to graduate.138 The best practice of Early Childhood Education directly impacts significant negative consequences of the achievement gapA gap occurs when one group of students performs better than another, and the difference is statistically significant. The groups may be classified by race or ethnicity, gender, or socioeconomic class.2 Occasionally, the achievement gap will be referred to as an opportunity gap to focus more on the lack of resources than student output..
Gaps
A considerable gap in early education is the variety of early education quality. There are few regulations on early childhood education and no universal early childhood education in the United States. This variety leads to a variety in the quality of ECEEarly childhood education.. Not all preschools are able to provide the structure and quality necessary to combat the achievement gapA gap occurs when one group of students performs better than another, and the difference is statistically significant. The groups may be classified by race or ethnicity, gender, or socioeconomic class.2 Occasionally, the achievement gap will be referred to as an opportunity gap to focus more on the lack of resources than student output..139 One study suggests that, above all other qualities, the relationship between student and teacher is the most significant, even more, important than teacher certifications.
Preferred Citation: Bradley, Kate. “The Socioeconomic Achievement Gap in the US Public Schools.” Ballard Brief. December 2022. www.ballardbrief.byu.edu.
Viewpoints published by Ballard Brief are not necessarily endorsed by BYU or The Church of Jesus Christ of Latter-day Saints